Navigating the Results Page
This guide provides a detailed explanation of the results page.
Table of Contents
1. Overview
A run is a specific execution of a test suite. The results page allows for easy access to every past run.
2. Menu Filters

Filtering tests shows only tests that match one or more of the filters. Filters can be cleared by unchecking the selected boxes, as well as with the Clear all filters button that shows up when any filters are selected
Result Filters
The Result Filters are designated based on the end status of a Run.
- Passed: Every test case in the run passed
- Failed: One or more test cases in the run failed
- Pending: One or more test cases in the run are pending
- Queued: The Schedule is planned to execute in the future
- Skipped: Every test case in the Schedule was skipped
Trigger Filters
These Filters are designated based on how the test execution was started.
- Manual: Test execution was manually started
- Scheduled: Regularly scheduled test run, configured in the overview of the Schedule
- GitHub Action: Test execution was triggered by GitHub Action
3. Viewing Runs
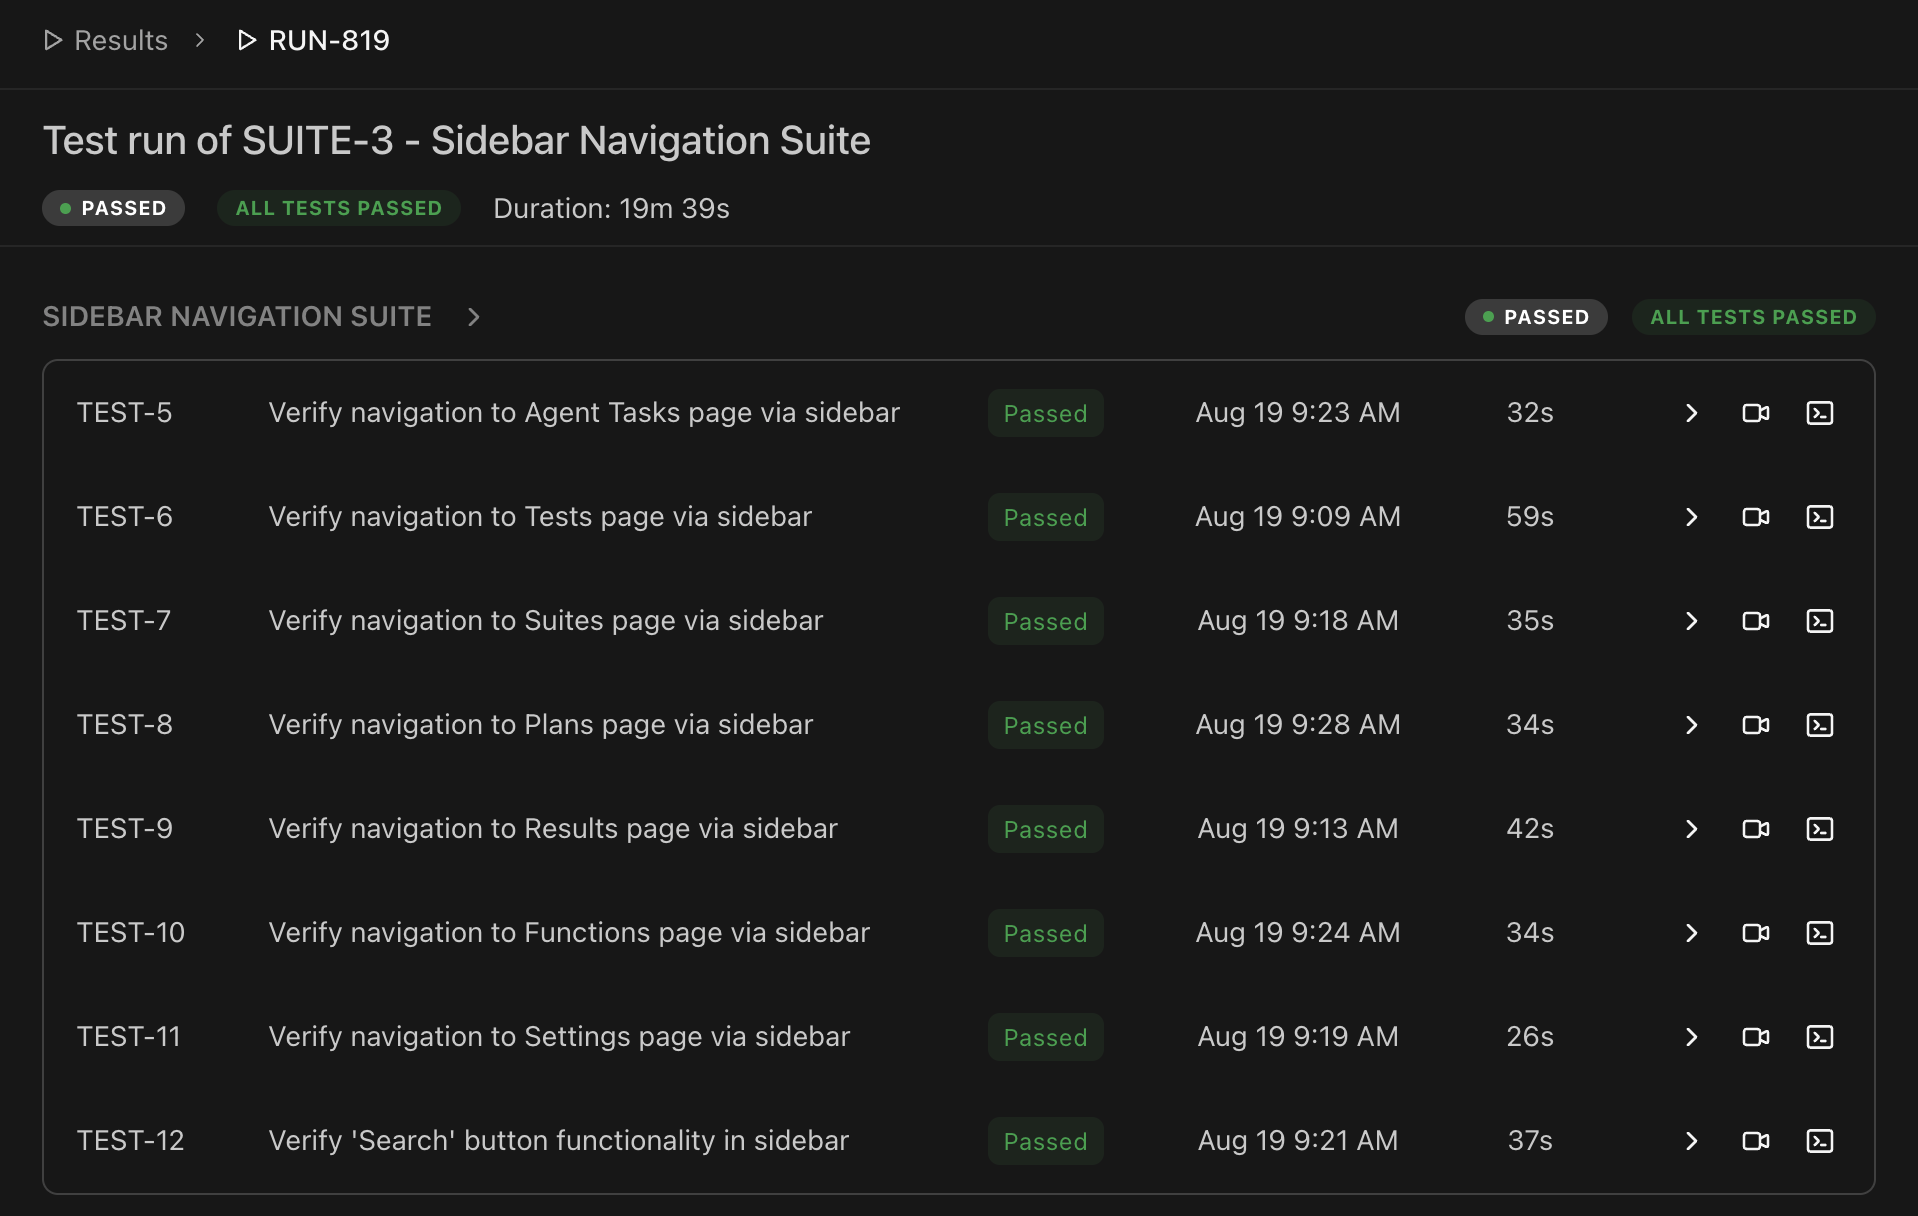
Runs can be viewed by clicking on the run in question, as well as through the report tab of the Schedule being run. Clicking into a Run displays a couple helpful metrics, as well as videos and logs for the instance. Run result, fail count, and Run duration can all be found in the top bar underneath the name of the Run.
Individual test results are grouped by suite, followed by a section for individually selected tests. Each test row displays the test status, run date, and execution time.
4. Viewing Test Instances
To navigate to a test instance, you can either click on the test inside of the run, or click on the test from the schedule report. This opens a detailed modal with comprehensive test execution information.
Overview Tab
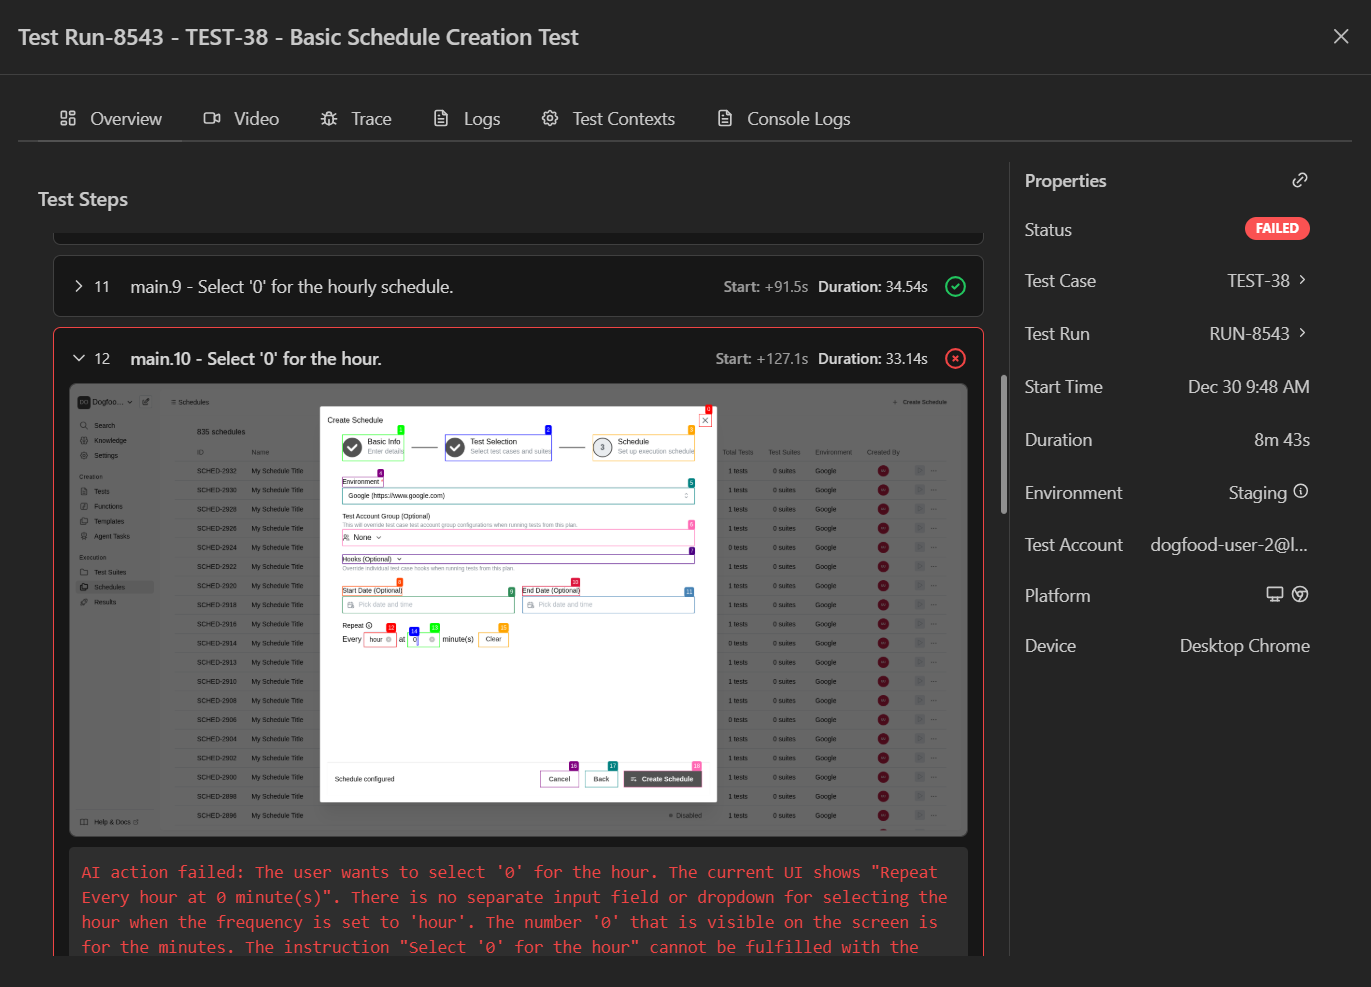
The Overview tab provides a comprehensive view of your test execution:
Test Steps (Left Panel)
- Visual step-by-step breakdown of test execution
- Screenshots captured at each step completion
- Status indicators for each step (passed/failed)
- Error messages for failed steps with AI-generated explanations
- Timing information for performance analysis
Properties Panel (Right Sidebar)
Displays key test information:
- Status - Overall test result (Passed/Failed/Flaky)
- Test Case - Link to the test definition
- Run Details - Link to the full test run
- Duration - Total execution time
- Start/End Time - Execution timestamps
- Environment - Test environment used
- Browser - Browser type and version
Video Tab
Watch the complete test execution:
- Full video recording of the browser during test
- Playback controls for reviewing specific moments
Trace Tab
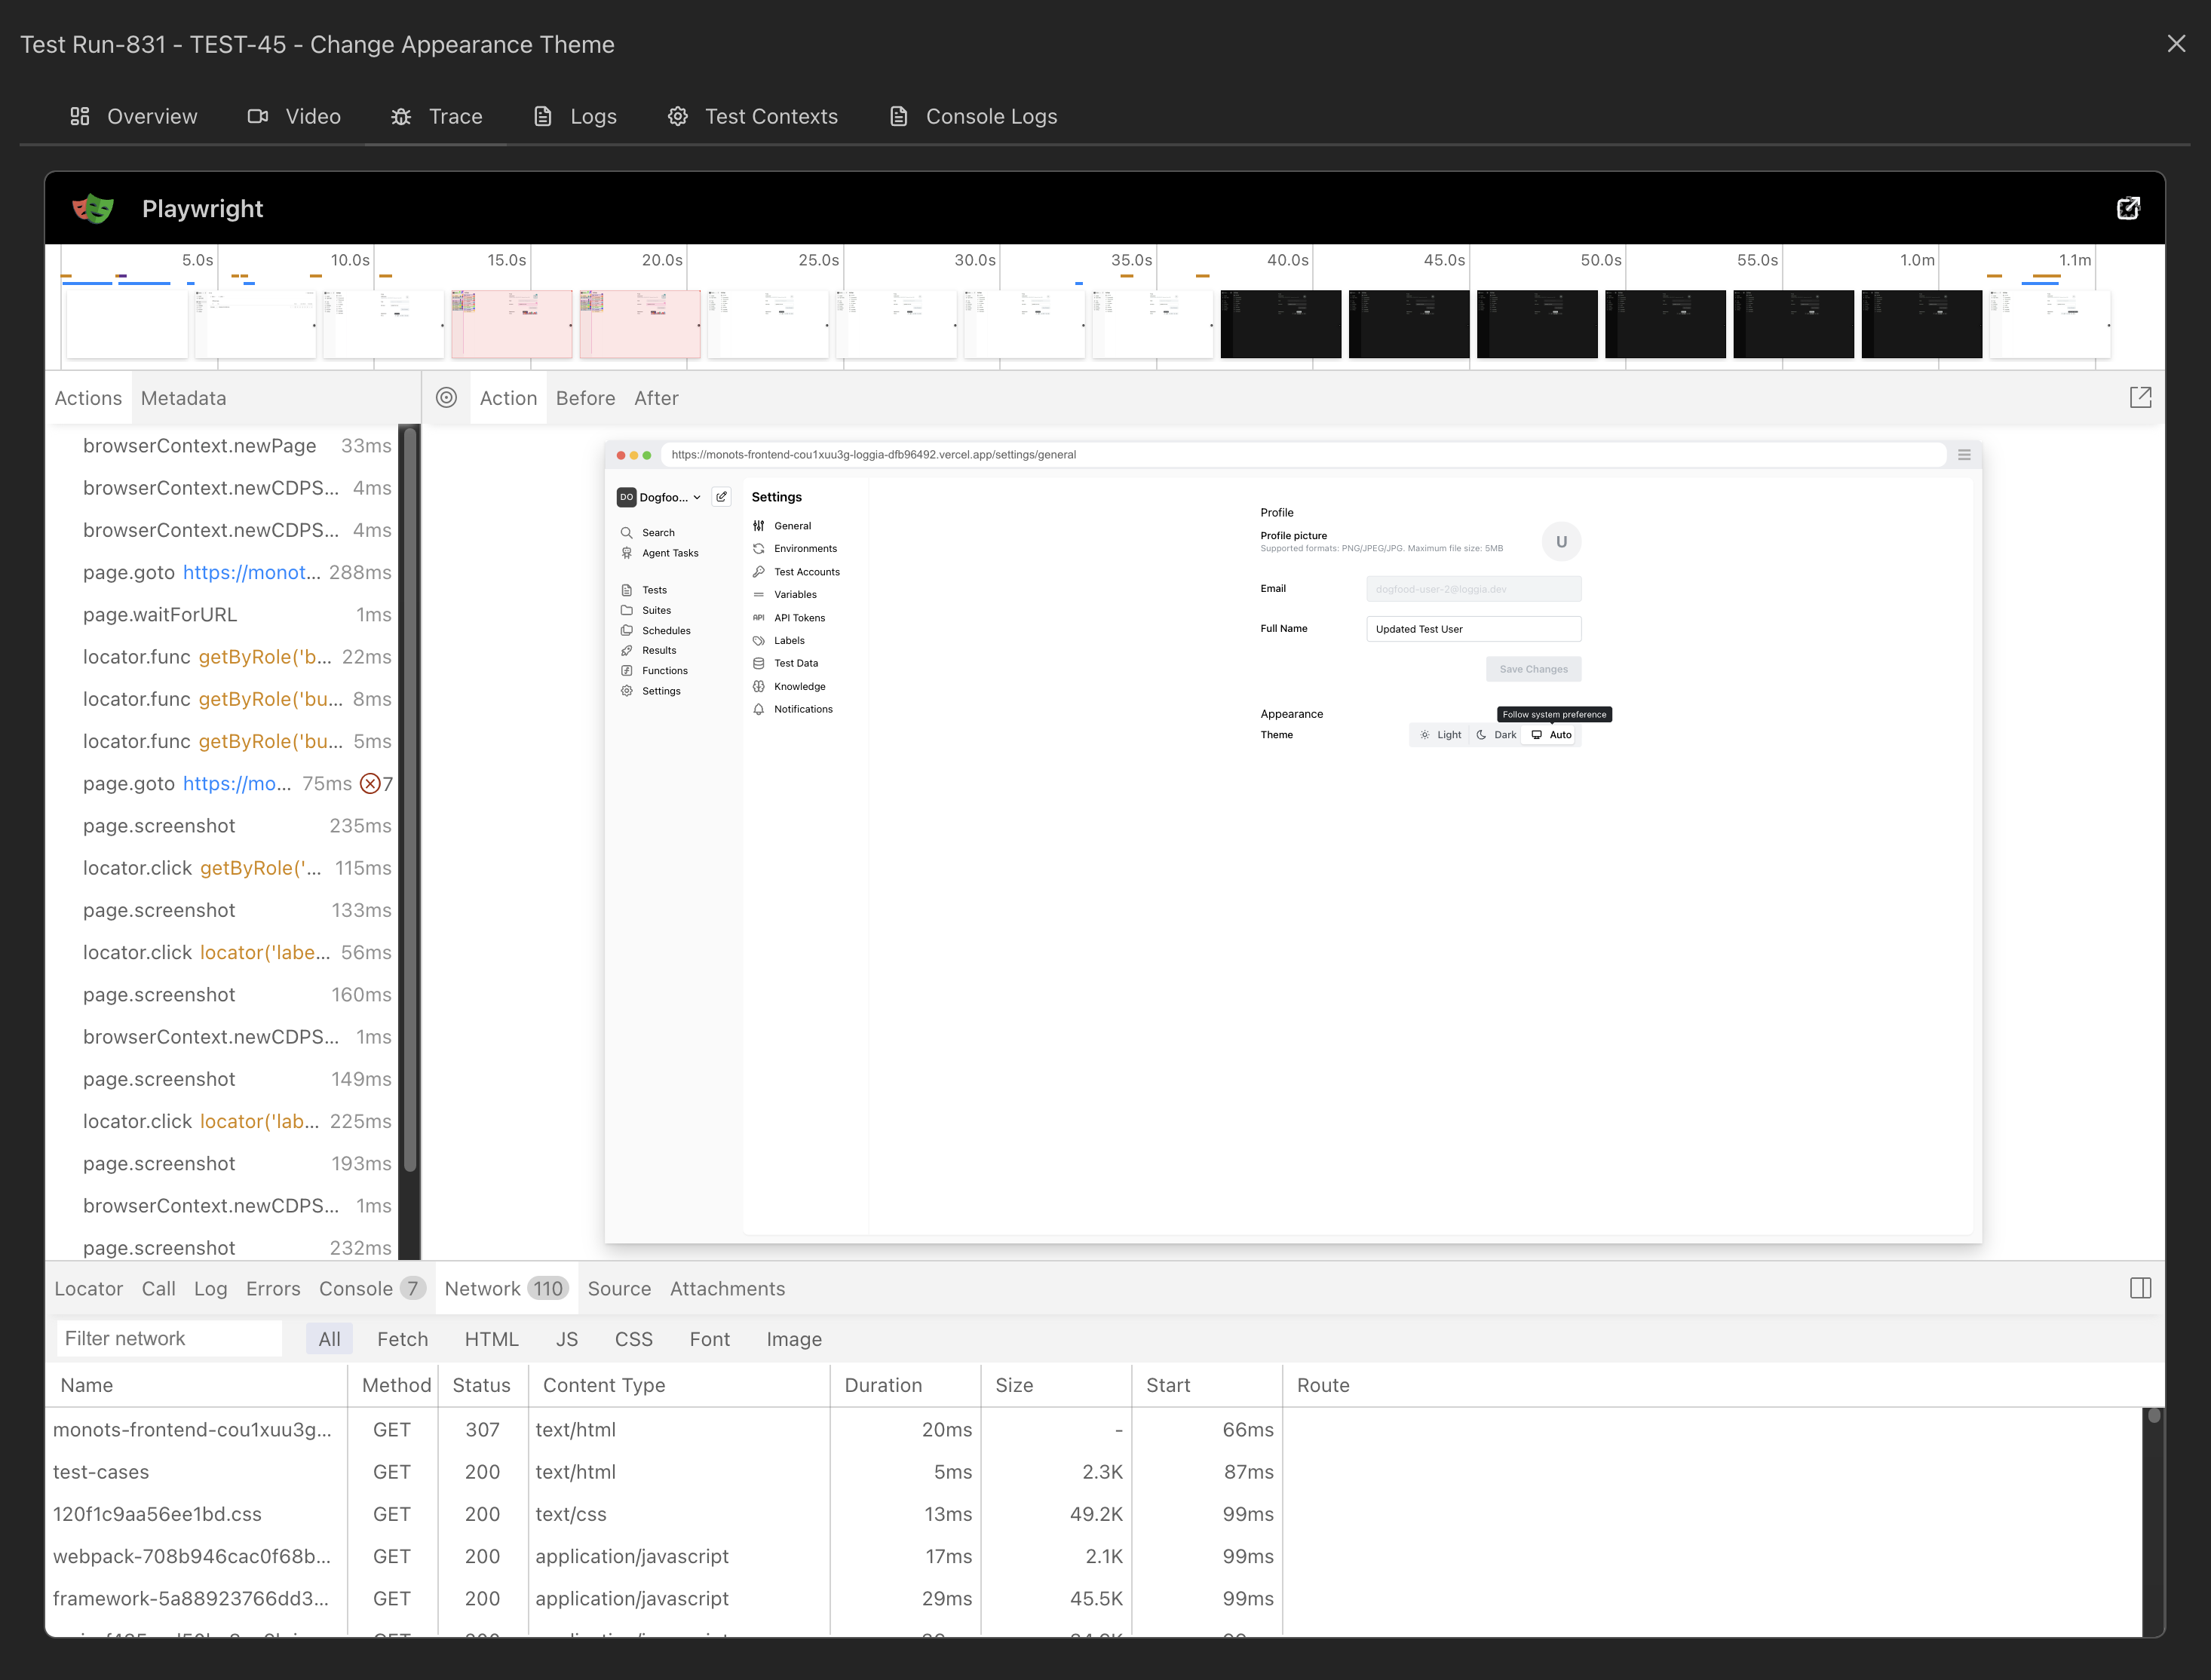
Debug test execution with Playwright trace files:
- Interactive trace viewer for detailed debugging
- Network activity and API calls
- DOM snapshots at each action
- Console logs and errors
Logs Tab
View detailed execution logs:
- Step-by-step execution logs from the test execution
- Formatted output with syntax highlighting
- Error stack traces for debugging
Test Contexts Tab
Inspect test variables and state:
- Test Context Before - Initial variable state
- Test Context After - Final variable state
- Shows all test variables used during execution
Console Logs Tab
Browser console output during test for debugging client-side issues:
- Log type (log, warning, error, etc.)
- Log messages with full details