VS Code Extension
The same visual debugger as shiplight debug, but integrated directly into VS Code — no browser tab switching required.
Installation
- Download the latest
.vsixfile from the GitHub releases page - In VS Code, open the Command Palette (
Ctrl+Shift+P/Cmd+Shift+P) and run Extensions: Install from VSIX… - Select the downloaded
.vsixfile
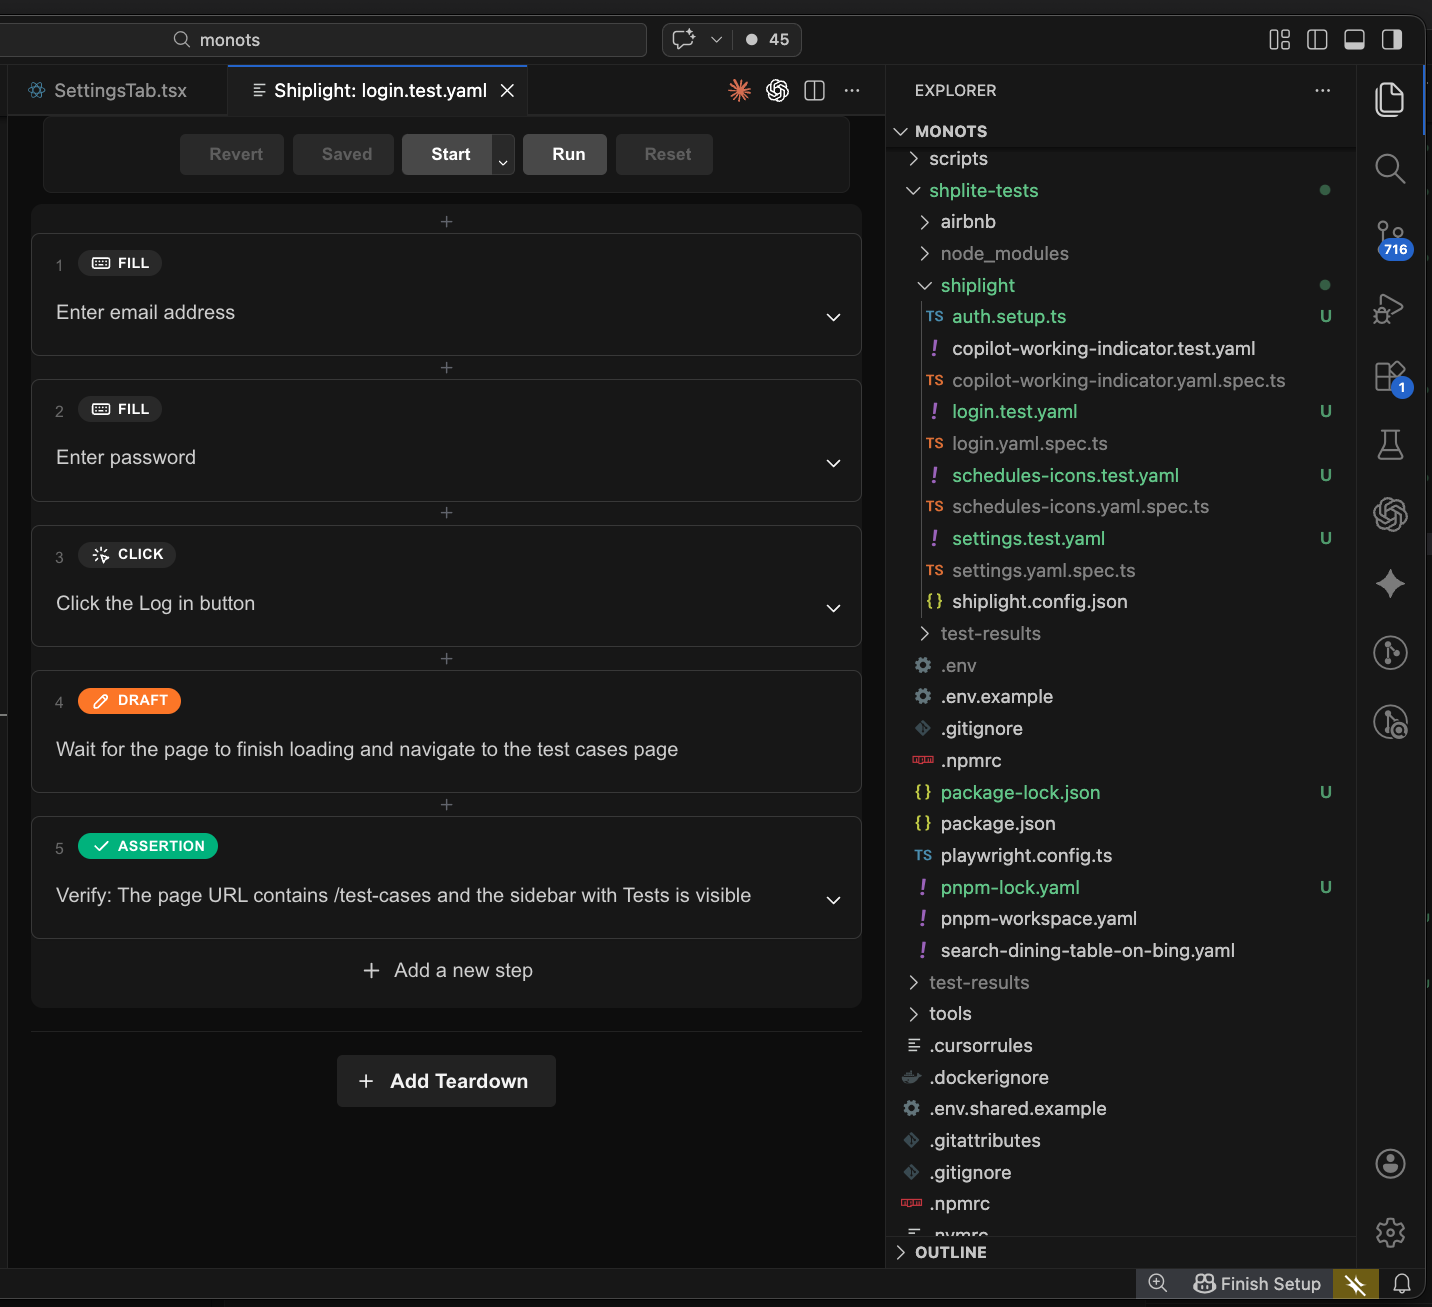
Create, run, and debug .test.yaml test files with an interactive visual debugger inside your IDE.
Features
Debug a test
Right-click any *.test.yaml file > Debug with Shiplight, or use the Command Palette.
The debugger opens in a webview panel where you can:
- Step through test statements one at a time
- Inspect and edit action entities inline
- See the browser session in real time
- Modify test steps and re-run immediately
Create a new test
Right-click a folder > Shiplight: New Test. Enter a name and starting URL — the extension scaffolds a new .test.yaml file and opens the debugger so you can start authoring immediately.
Logs
Server output is available in the VS Code Output panel — select Shiplight Debugger from the dropdown.
Requirements
- VS Code 1.85+
- Shiplight CLI installed globally or in your project